💰Profit and loss
How Shippified works out revenue, costs, subscription overhead and profit, and how to read the Profit & loss tab for a month, quarter, year or all time.
- Written for
- Resellers who want to know what they're actually making
- Applies to
- All plans
- Deprecated
- + Deprecated
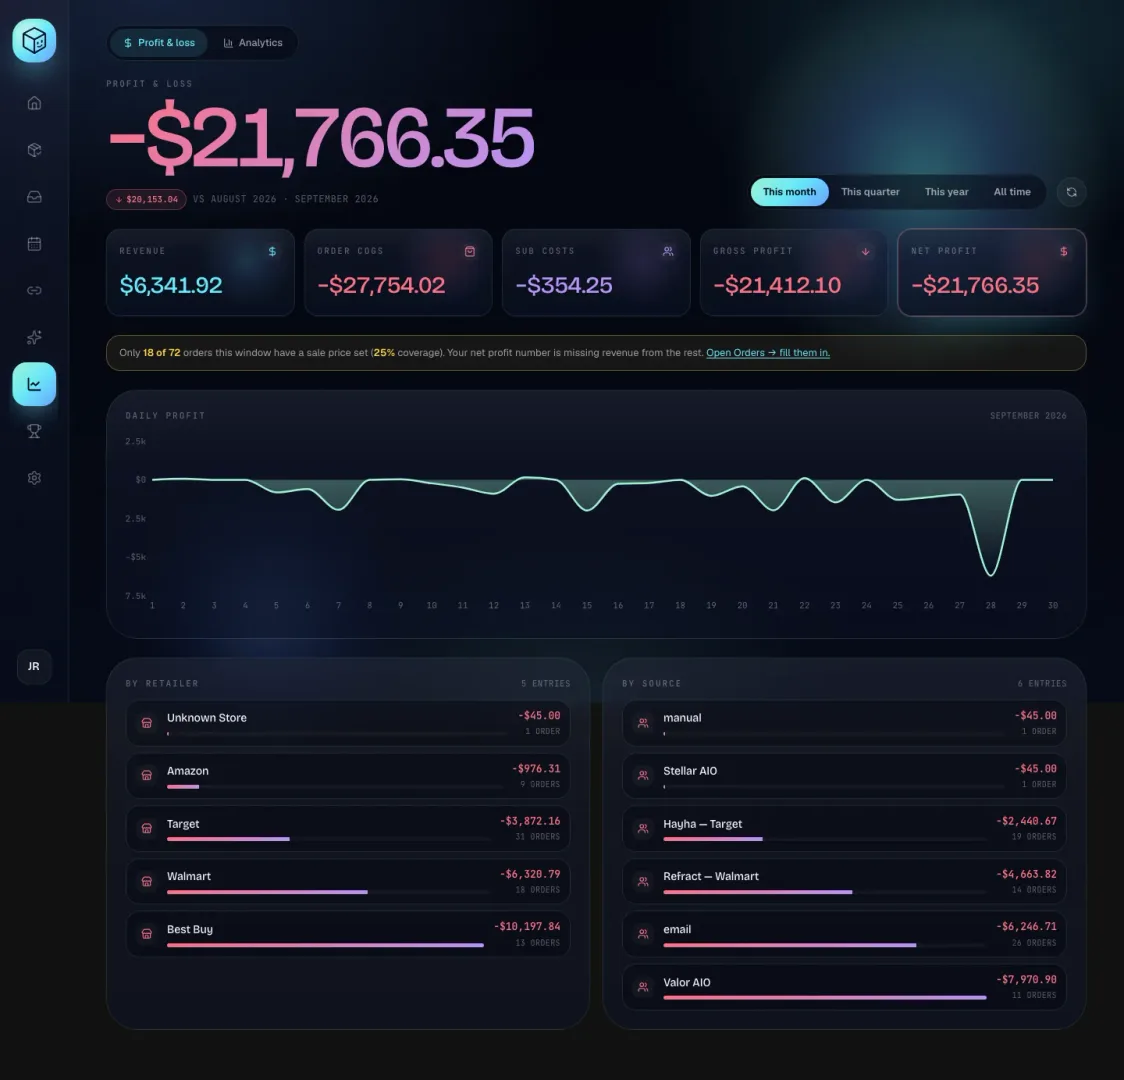
The Profit & loss tab in Insights shows what you made over a month, a quarter, a year or all time. It combines three numbers: what you paid for each order (its cost), what you sold it for (its sale price), and what it costs you to run your operation, such as monitors, proxies and servers (your subscriptions). Shippified fills in costs automatically from your checkout messages. Sale prices are always yours to enter. This page explains where each number comes from, how every figure on the tab is calculated, and how to fill in the gaps.
Before you start
Profit & loss needs two kinds of data to be useful:
Orders with a cost. These come in automatically when your bots and inboxes send checkouts. See Connect Discord monitor bots and Connect an email inbox.
Sale prices on the orders you've sold. You enter these yourself (see Record a sale price).
Subscriptions are optional. Without them, Sub costs is $0.00 and net profit equals gross profit.
Open Profit & loss
- Open Insights
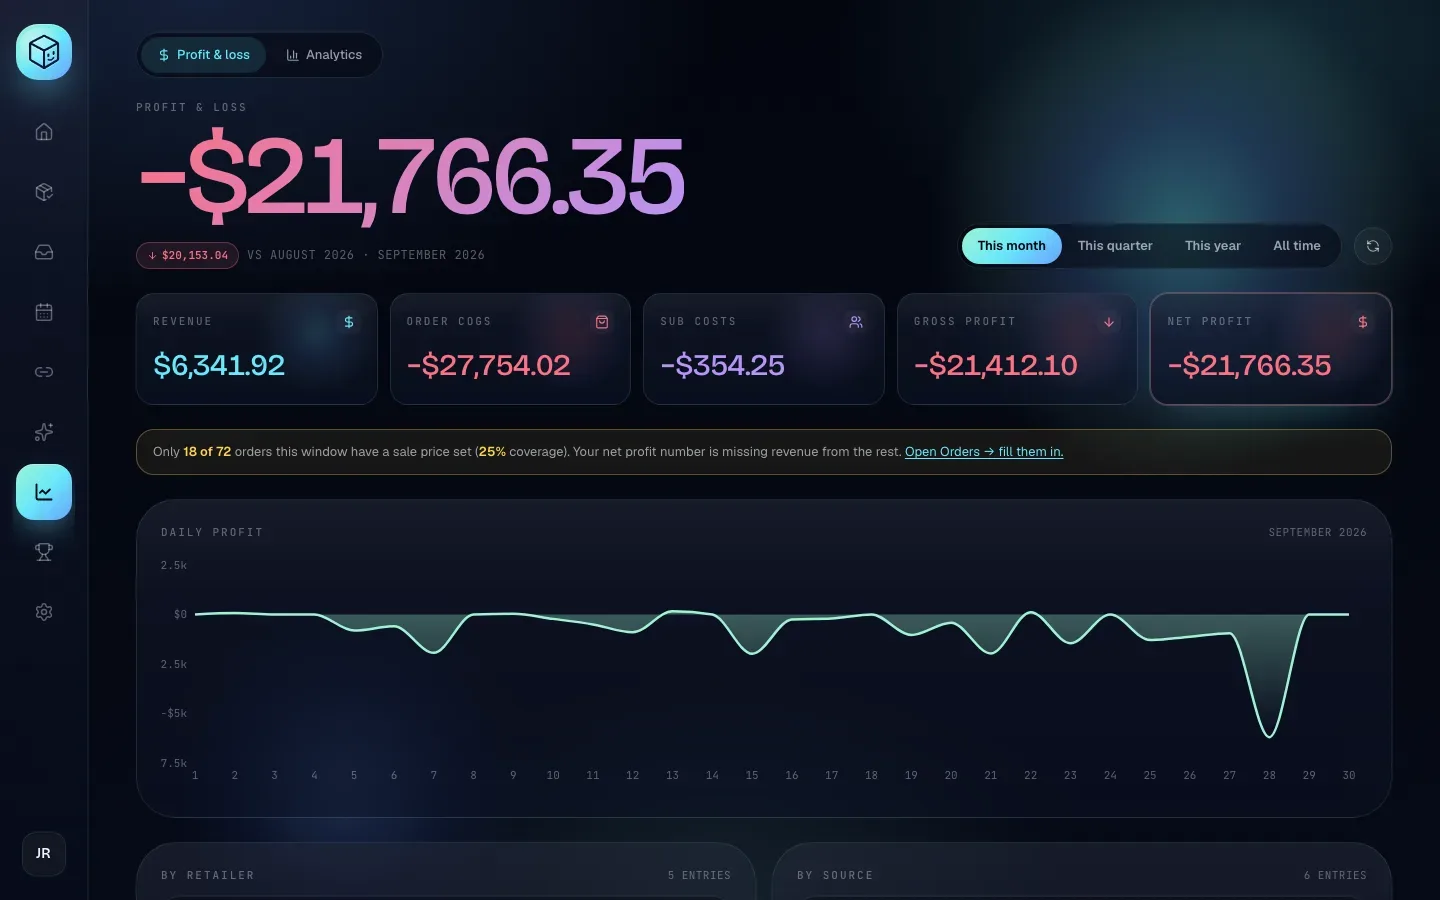
In the sidebar, click Insights (the chart icon). The Profit & loss tab opens by default, on This month.
- Pick a range
At the top right, click This month, This quarter, This year or All time. The page recalculates for that range. Each range has its own address (
/profitability/month,/profitability/quarter,/profitability/yearand/profitability/all), so you can bookmark the one you check most. - Refresh if needed
The figures are worked out when the tab loads. If you've just entered sale prices in another tab, click the round-arrow Refresh button next to the ranges.
Where the numbers come from
Cost: what you paid
Shippified fills in each order's cost from the checkout message that created it:
If the message (read through a built-in or custom template) has an item price, that's the cost.
Otherwise, Shippified uses the message's order total.
It reads the first amount it finds.
$1,249.99becomes $1,249.99; currency symbols and thousands separators are ignored.
Quantity isn't multiplied in. If a message says "Qty 2" and shows $99.98, the cost is $99.98, whatever that amount represents in the message.
If the message has no price at all, the order has no cost. You can add one yourself:
New order: fill in Cost ($) in the Add an order dialog on the Orders page.
Existing order without a cost: open the order, fill in Cost ($) under Pricing, then click Save changes.
Cost is fill-in-only. Once an order has a cost, the Cost ($) field shows a lock icon and can't be edited. If costs are wrong across many orders, fix the template that reads those messages, then click Re-run parsing on the Templates page. Re-parsing rebuilds costs from your messages and never touches sale prices. See Custom templates.
Sale price: what you sold for
Sale price is the amount you resold the item for. Shippified never guesses it: you enter it, and you can change or remove it at any time. See Record a sale price.
Subscriptions: your overhead
Subscriptions are the recurring costs of running your operation. You manage them in Calendar → Subscriptions. See Add your subscriptions and How subscription costs are spread.
Record a sale price
You can record a sale price in two places.
- From the order drawer
- From Home's recent orders
- Open the order
On the Orders page, click the order's row. Its drawer opens on the right.
- Find Pricing
Scroll down to the Pricing section. Cost ($) shows what you paid (with a lock icon if it's already set). Sale price ($) is always editable.
- Enter the sale price
Type the amount, for example
181.96. A leading$and thousands commas are fine ($1,250), and so is.5. Use at most two decimal places. - Save
Click Save changes. The button briefly shows Saved.

To remove a sale price, empty the Sale price ($) field and click Save changes. If the field has something that isn't an amount, the drawer shows "Sale price must be a dollar amount like 49.99." (or "Cost must be…") and saves nothing, so your existing price is kept. If saving fails for another reason, the error shows at the bottom of the drawer.
- Find the order
On Home, find the order in the recent orders list. Use Search orders… if it isn't among the latest ten.
- Click + sale price
Click + sale price under the order. A small
$box appears. - Enter and save
Type the amount and press Enter or click Save. Press Escape or click the × to cancel. Saving with the box empty just closes it without recording anything.
Once saved, the order shows sale $X and a profit chip: +$Y profit in green, or a negative amount in red. To change the price, click it. To remove it, click it and then click Clear.
The profit shown on a single order is simply:
order profit = sale price − cost (a missing cost counts as $0)Sale prices survive re-parsing and mailbox rebuilds, so you can rebuild your orders from templates or from your inbox without losing them.
Add your subscriptions
- Open the Subscriptions tab
In the sidebar, click Calendar, then the Subscriptions tab.
- Click Add
Click Add to open the subscription form.
- Fill in the form
Name: what it is, for example
Hayha · Pro. Required; Add subscription stays greyed out until you type one.Cost: the price of one billing period, for example
49.99.Currency: a label such as
USD. It isn't converted (see the warning below).Frequency: weekly, monthly, quarterly or yearly.
Start date: the day you started paying. Overhead is counted from this date.
Category: a label for grouping, for example
monitorsorproxies.Active: leave it ticked (Renewing).
End date (optional): leave it empty unless you already know when you'll stop paying. Overhead stops at this date.
Notes (optional): anything you want to remember.
- Save it
Click Add subscription. The subscription appears in the list with its frequency and cost, plus a per-month figure for anything that isn't monthly.
To edit a subscription, click the pencil icon on its row; the same rules apply as when adding (the name can't be empty and is cut to 80 characters, and the cost can't be negative). If a save is refused, the reason shows at the top of the form.
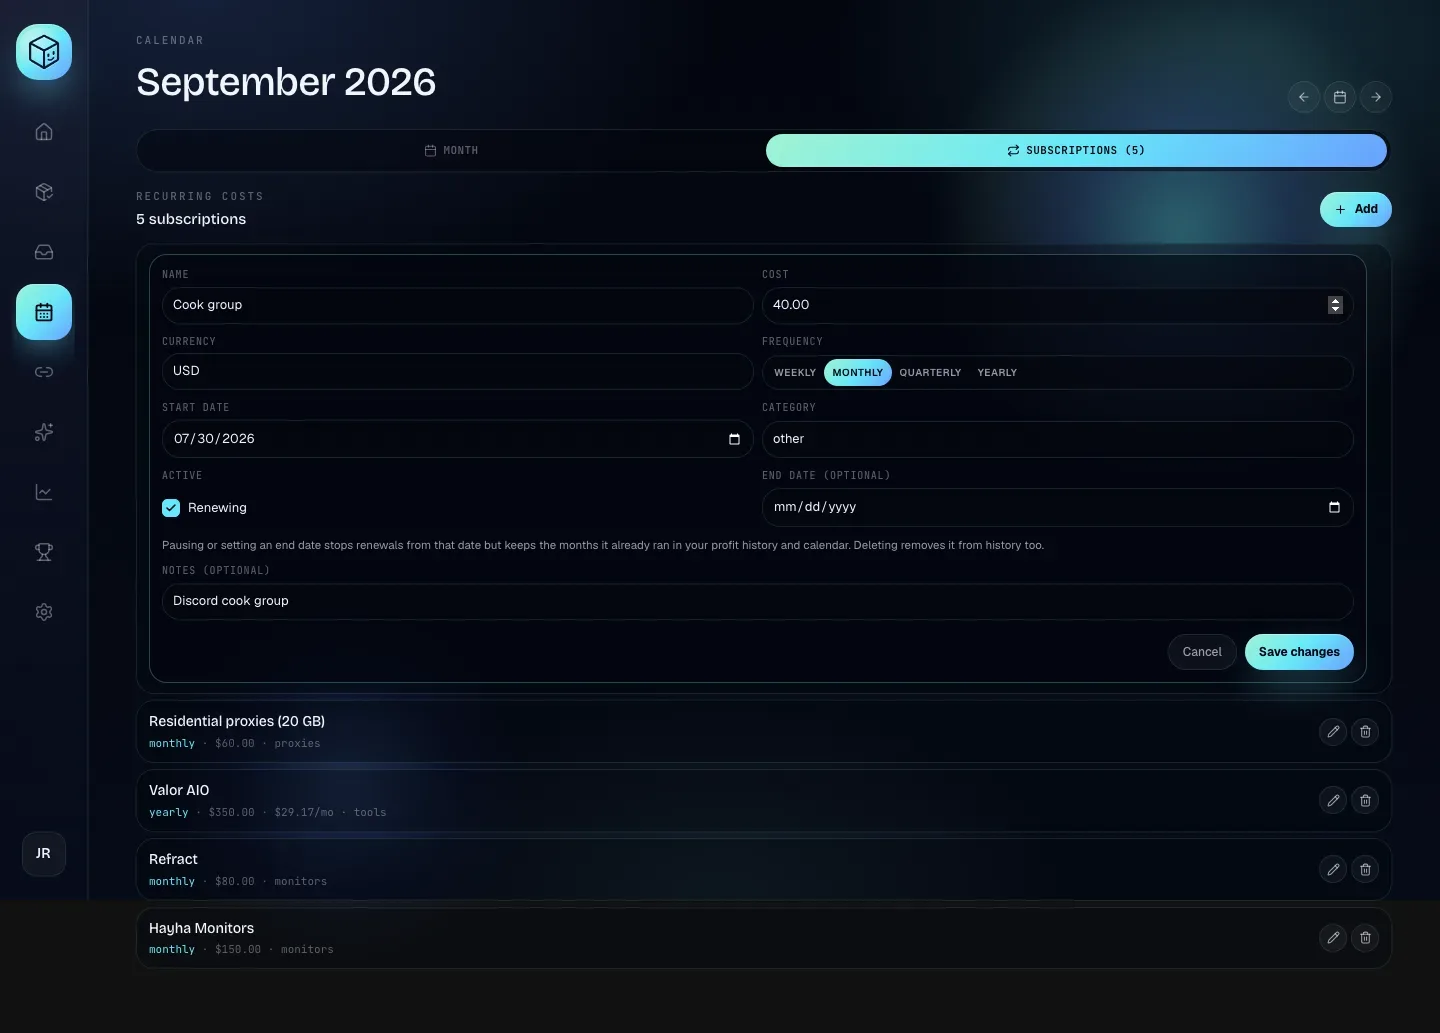
Subscription amounts are added up exactly as entered. The currency field is only a label; nothing is converted. Enter every cost in the same currency as your order prices.
Stop a subscription without changing past months
When you cancel a tool, edit its subscription and either untick Active (it's paused from today) or set an End date (optional), then click Save changes. Its overhead stops from that date, and every month before it keeps its cost. To start paying again later, tick Active and save: Shippified adds a new subscription from today, so the months in between stay uncharged. See Pause or end a subscription.
Deleting a subscription (the trash icon, then Delete subscription) removes its overhead from every period, including past months you've already reviewed. Pause it or give it an end date instead if you want past months to stay the same.
Read the Profit & loss tab
The ranges
Button | Orders included | Overhead counted for |
|---|---|---|
This month | Orders dated from the 1st of this month up to the 1st of next month | The whole month, including days still to come |
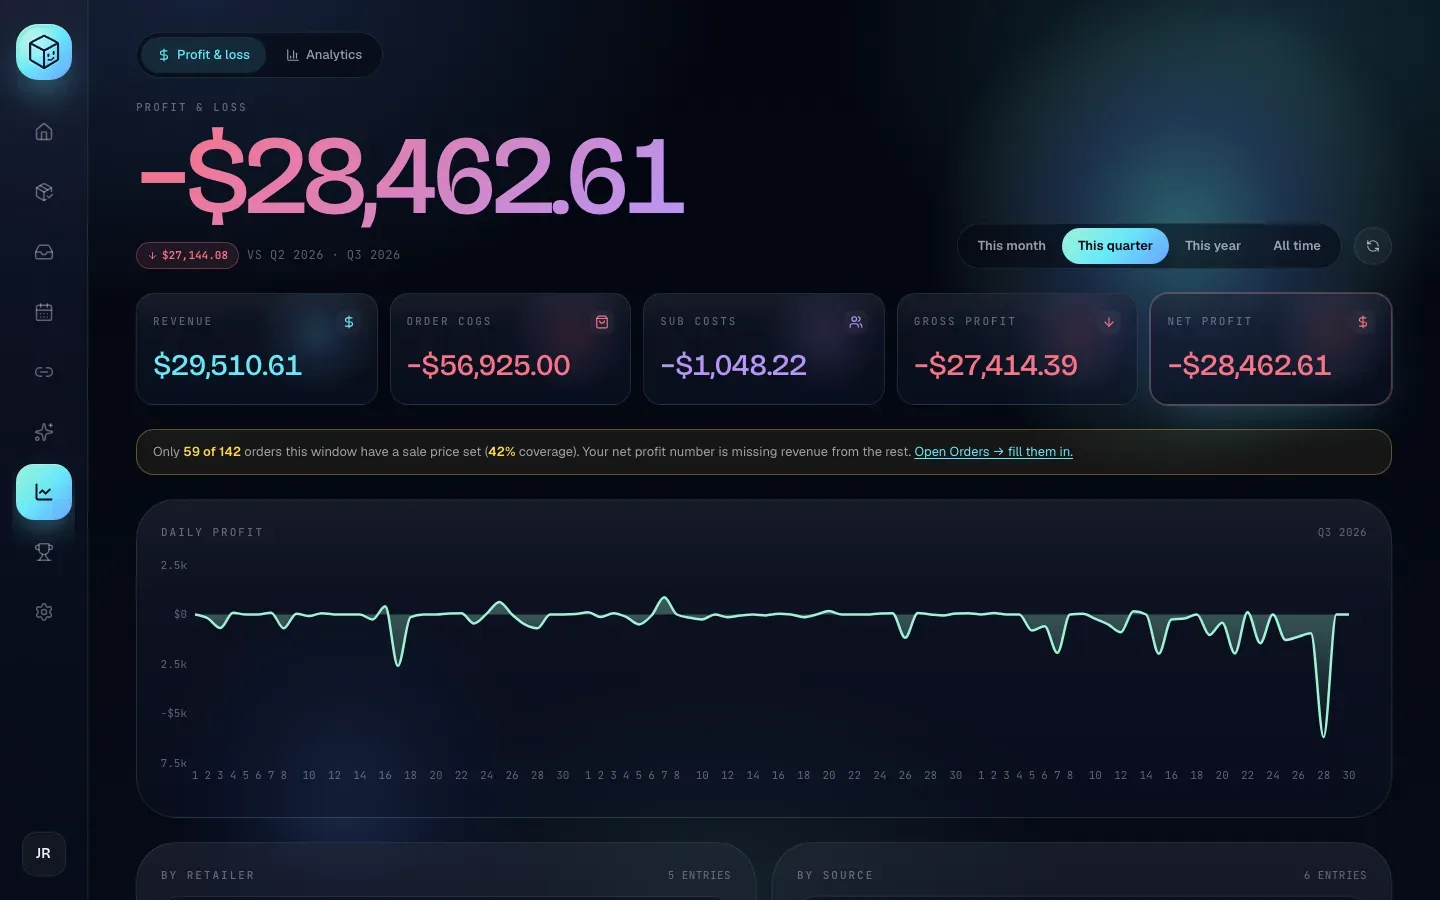
This quarter | Orders dated in the current calendar quarter (Jan–Mar, Apr–Jun, Jul–Sep or Oct–Dec) | The whole quarter |
This year | Orders dated January 1 to December 31 of this year | The whole year |
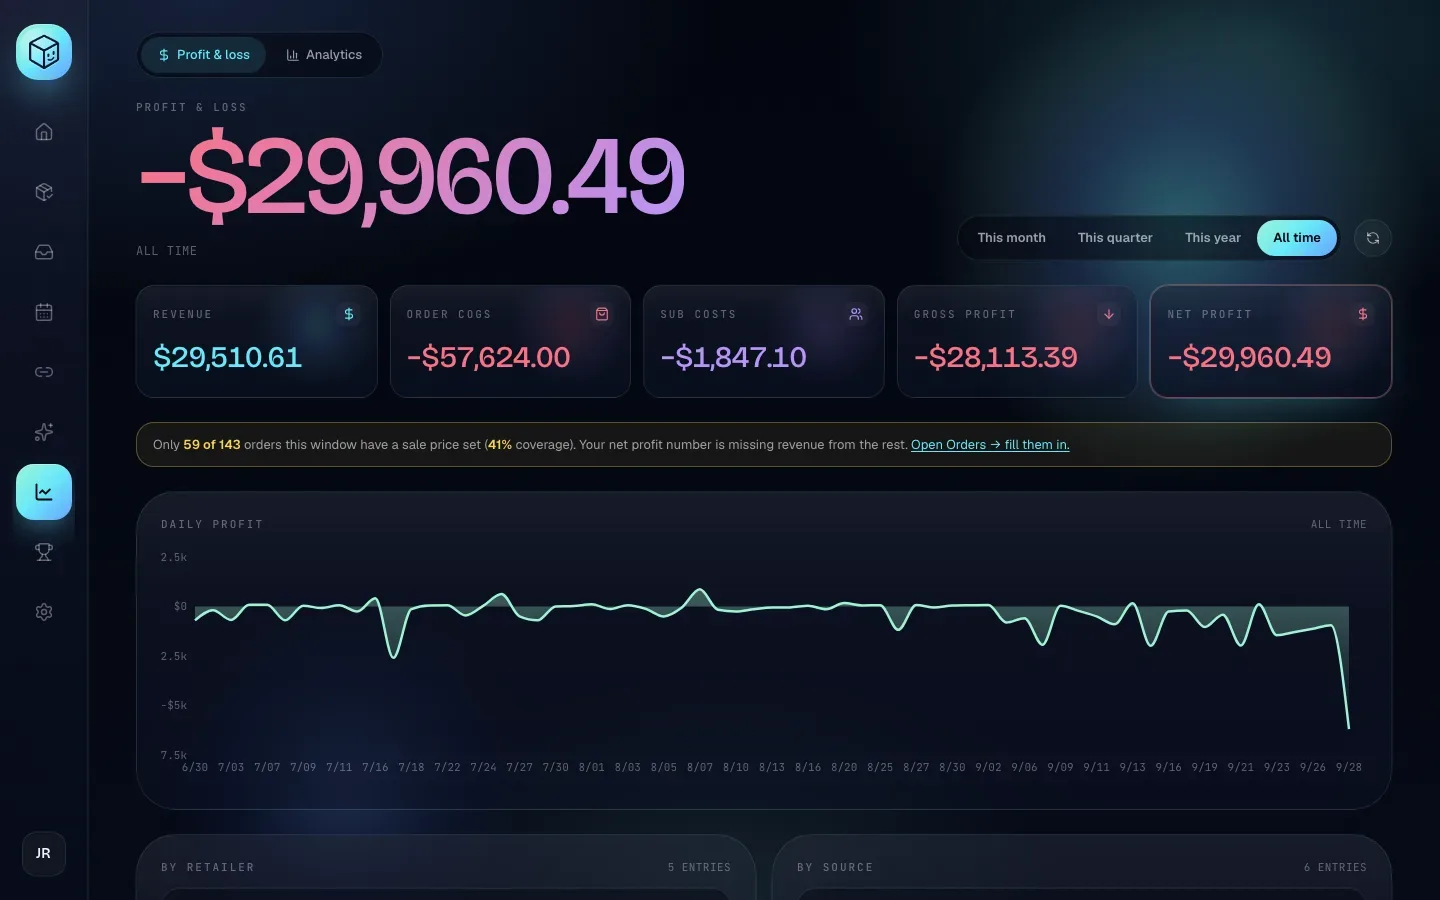
All time | Every order you have | From each subscription's start date up to right now |
An order's date is the date it was first received, shown as Received at the bottom of the order drawer. For an order you added by hand, it's the Order date you entered. All ranges use UTC dates, so an order placed late in the evening in the Americas can fall on the next day.
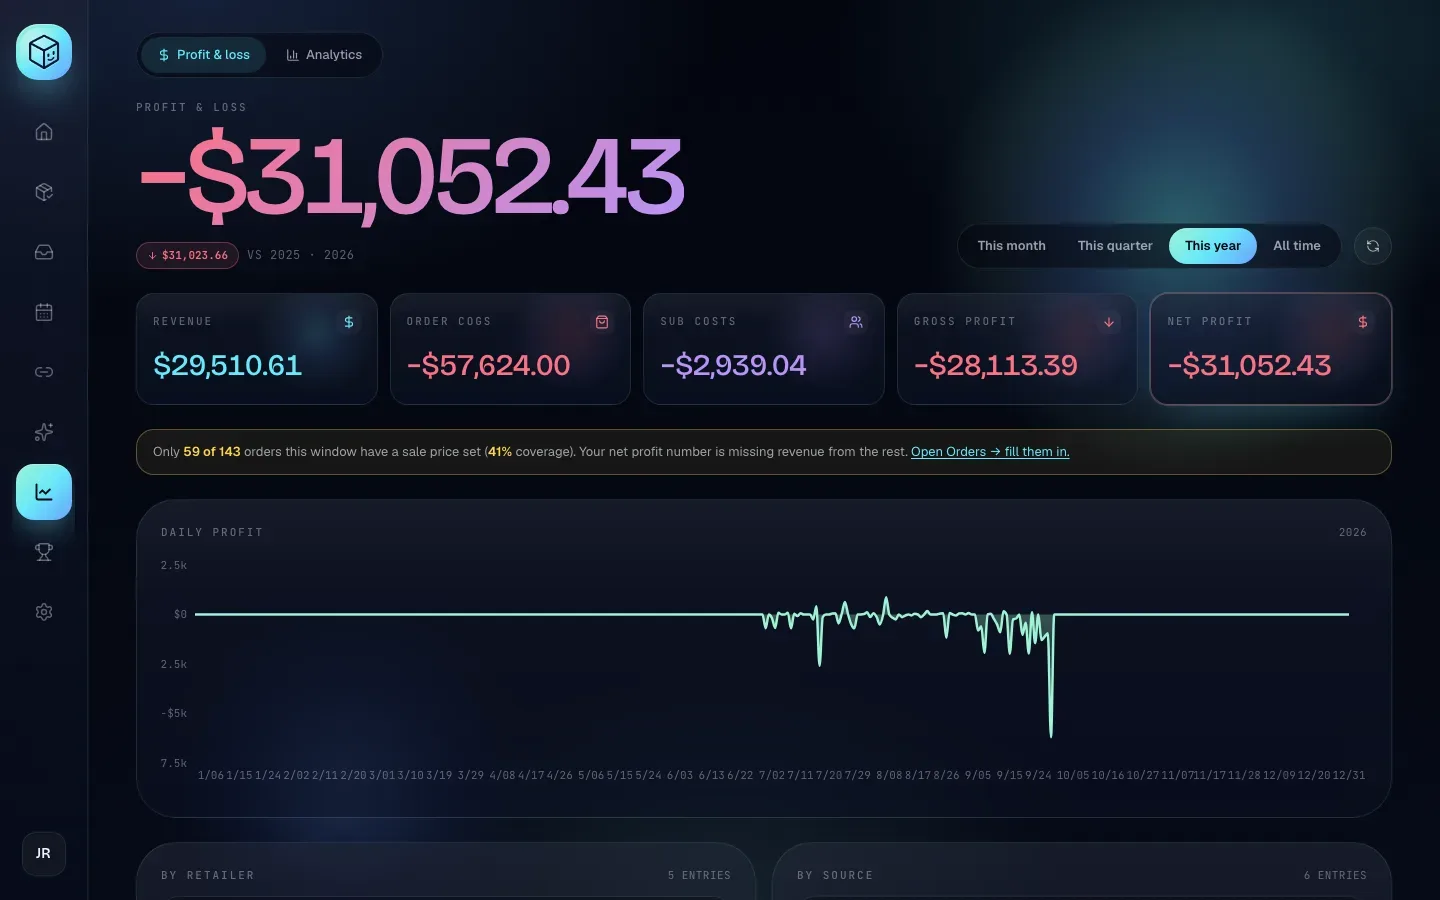
The headline and change chip
The large figure at the top is your net profit for the range. It's green when positive and red with a minus sign when negative.
Under it, a chip compares net profit with the previous period of the same kind, for example vs August 2026 · September 2026:
Range | Compared with |
|---|---|
This month | Last month (its real length: March is compared with the whole of February) |
This quarter | Last quarter, for example |
This year | Last year, for example |
All time | Nothing. Only the label All time is shown. |
The chip shows the difference between the two net profits. A down arrow in red means this period is lower by that amount; an up arrow means it's higher.
Early in a month the chip usually points down. This month already includes the full month's overhead but only the orders you've had so far, while last month is complete.
The five tiles
Tile | How it's calculated |
|---|---|
Revenue | The sum of sale prices of the orders in the range. Orders without a sale price add $0. |
Order COGS | The sum of costs of every order in the range, whether or not it has a sale price. COGS means cost of goods sold. Shown with a minus sign because it's money going out. |
Sub costs | Your subscription overhead for the range (see below). Shown with a minus sign. |
Gross profit | Revenue − Order COGS |
Net profit | Gross profit − Sub costs. The same figure as the headline. |
Gross and net profit keep their real sign: a loss shows as, for example, −$47.45 in red.
Every order in the range counts toward Order COGS, including canceled orders and orders you haven't sold yet. An order with a cost but no sale price reduces profit by its full cost. That's why a range full of unsold stock shows a loss.
The coverage prompt
When fewer than half of the orders in the range have a sale price, a banner appears under the tiles:
Only 17 of 71 orders this window have a sale price set (24% coverage). Your net profit number is missing revenue from the rest. Open Orders → fill them in.
Click Open Orders → fill them in. to go to the Orders page, then add sale prices to the orders you've sold as described in Record a sale price. Once at least half the orders in the range have one, the banner goes away. A sale price of $0 counts as set: an item you gave away or wrote off still counts as priced.
On the Orders page, the Price column shows an order's sale price once it has one, tagged sale, and its cost until then, tagged cost. Sorting by Price: high → low is a quick way to find the expensive items worth pricing first.
Daily profit
The Daily profit chart plots, for each day, the sale prices minus the costs of that day's orders. Subscription overhead isn't included. Hover over a point to see profit · +$X for that day.
This month and This quarter show every day of the period, labelled by day of the month. Days with no orders sit at $0.
This year and All time label days as month/day, for example
7/15. All time only includes days that had orders, so the spacing along the bottom isn't even.
When no order in the range has a cost or a sale price, the chart is replaced by "No revenue captured in this window yet — set sale prices on parsed orders to populate the chart."
By retailer and By source
These two lists add up the per-order profit (sale price − cost) of the orders in the range:
By retailer groups them by store: Target, Walmart, Amazon, Best Buy, or Unknown Store.
By source groups them by where they came from: the bot's name for orders from a Discord bot,
emailfor orders from retailer emails, ormanualfor orders you added.
Each row shows the profit (with a + when positive), the number of orders, and a bar sized against the largest row. Rows are sorted from most to least profitable, and the top 12 are shown. The count in the corner, such as 5 entries, includes every group. Subscription overhead isn't spread across these rows; it only appears in Sub costs and Net profit.
If the range has no orders, each list says "No by retailer activity in this window." or "No by source activity in this window."
How subscription costs are spread
Sub costs aren't charged on renewal dates. Each subscription's price is turned into a daily rate and spread evenly over every day it's active:
Frequency | Daily rate |
|---|---|
weekly | cost ÷ 7 |
monthly | cost × 12 ÷ 365 |
quarterly | cost × 4 ÷ 365 |
yearly | cost ÷ 365 |
For each subscription, Shippified multiplies the daily rate by the number of days the subscription overlaps the range, from its Start date up to its end date (or the date it was paused), and rounds to the cent. Sub costs is the total across all your subscriptions.
What this means in practice:
A subscription that starts partway through a range only counts from its start date, and one that ends or is paused partway through only counts up to that date.
A monthly subscription doesn't add exactly its price to every calendar month. A $30/month tool adds $29.59 to a 30-day month and $30.58 to a 31-day month. Over a year it adds up to $360.
All time counts overhead up to the present moment, never into the future. The other ranges count the whole period, including days that haven't happened yet.
The renewal dates shown on the Calendar don't affect Sub costs.
Worked example
Suppose it's a day in June (30 days). You have three orders dated in June and two subscriptions that started before June.
Order | Cost | Sale price | Order profit |
|---|---|---|---|
A | $120.00 | $180.00 | +$60.00 |
B | $80.00 | $95.00 | +$15.00 |
C | $50.00 | not set | −$50.00 |
Subscription | Price | Daily rate | × 30 days |
|---|---|---|---|
Monitor | $30.00 monthly | $30.00 × 12 ÷ 365 = $0.9863 | $29.59 |
Proxies | $10.00 weekly | $10.00 ÷ 7 = $1.4286 | $42.86 |
With This month selected:
Figure | Calculation | Result |
|---|---|---|
Revenue | $180.00 + $95.00 | $275.00 |
Order COGS | $120.00 + $80.00 + $50.00 | −$250.00 |
Sub costs | $29.59 + $42.86 | −$72.45 |
Gross profit | $275.00 − $250.00 | $25.00 |
Net profit | $25.00 − $72.45 | −$47.45 |
Two of three orders have a sale price (67%), so there's no coverage banner. By retailer and By source would show +$60.00, +$15.00 and −$50.00 grouped by each order's store and source; the $72.45 of overhead doesn't appear there.
Now you sell order C for $75.00 and enter that sale price. Revenue becomes $350.00, gross profit $100.00, and net profit +$27.55. One missing sale price was the difference between a loss and a profit.
Troubleshooting
My net profit is a large loss even though I'm selling at a profit
Almost always, most orders in the range have no sale price, so their full cost counts against you with no revenue to balance it. Check the coverage banner. Filling in sale prices for sold items fixes it. Unsold stock also counts as a cost until you sell it.
I can't change an order's cost
Cost locks once it's set, whether Shippified read it from the message or you typed it. If the amount came from the wrong part of the message, fix the template and click Re-run parsing on the Templates page. See Custom templates.
The cost is double what I paid per item
The message's price or total covered several units, and Shippified doesn't divide by quantity. Record the sale price for the whole order (all units together) so profit still comes out right.
It says "Sale price must be a dollar amount like 49.99."
The Sale price ($) (or Cost ($)) field contains something that isn't an amount, such as about 180 or 181.965. Nothing was saved. Type an amount such as 181.96 or $181.96 and click Save changes again.
Sub costs changed for a month I'd already closed
Subscription overhead is recalculated every time from your current subscriptions. Deleting a subscription, or editing its cost, frequency or start date, changes every period it overlaps. Pausing it or setting an end date only changes periods from that date on.
The page says "Couldn't load profitability — …"
The figures couldn't be loaded; the rest of the message gives the reason. Click Retry. If it keeps failing, reload the page and check that you're still signed in. ("Computing margin…" only shows while the figures load.)
An order appears in a different month than I expected
Ranges use the order's received date in UTC. An order received at 9 p.m. on the 31st in New York is dated the 1st in UTC, so it counts in the next month.